1. Traceroute Doesn’t Work? Try MTR to Debug
1.1. What does traceroute do?
Command traceroute (Linux) or tracert (Windows) is a useful tool to check the network path between the host and the destination host. The underline protocol is ICMP. Your host sends a sequence of packet with TTL (time-to-live) increasing from 1 with step 1, and each packet is dropped once steped TTL hops away. By computing the time difference between transmission and the receival of reply, traceroute is able to figure out the latency of each path(hop).
The following is an example of traceroute result by tracing the path from my home to rpi’s webserver.
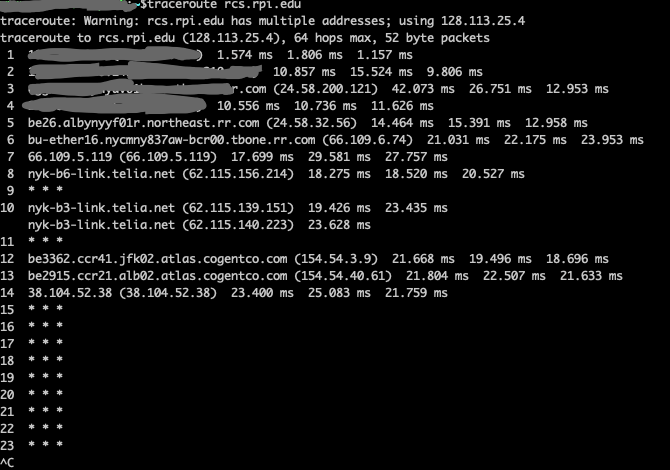
You can see three results for each hop (row), e.g. 1.574ms, 1.806ms, 1.157ms for row 1, each number means the measured Round Trip Time (RTT) between your host and the hop for three separate measures.
However, you also can see that hops 9, 11 are “* * *”, which means no reply was heard from these hops. What’s going on? Should we blame the firewall who may filtered out the ICMP packet or the low link quality? In order to explore more, we introduce MTR, a powerful tool doing better than traceroute.
1.2. What does MTR do?
The advantage of MTR I’m going to emphasize here is it’s ability to tell you which hop should be blame. Here is an example result by tracing the path to the same rpi webserver, and we asked MTR to check each hop for 50 times.
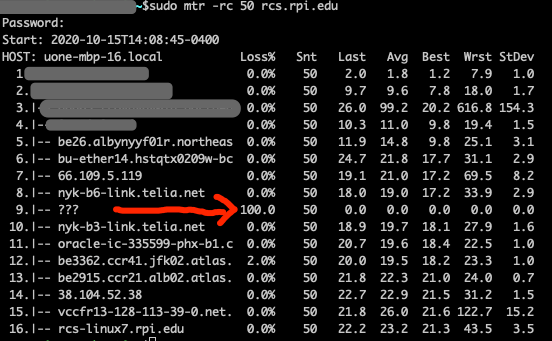
Compared with traceroute’s result, MTR completes the tracking and also indicates that something is wrong at hop 9. That’s true, because hop 9 is a firewall deployed inside rpi’s network that blocks all ICMP traffic.
Q: Why hop 3 seems to show unexpected long latency in MTR’s result?
A: By default MTR uses ICMP, and ICMP is assigned with low prorities by some routers. It’s possible that the router is very unhappy to deal with ICMP traffic :p